IoT Dashboard Design: Create Powerful Data Visualizations
Imagine a world where mountains of sensor data transform into clear, actionable insights. Where flickering dashboards, once a source of frustration, become intuitive guides, illuminating the path to efficiency and innovation. This isn’t science fiction; it’s the reality unlocked by expertly designed IoT dashboards. For professionals in the IoT and technology sectors, mastering the art of IoT visualization is no longer a luxury – it’s a necessity. This is your guide to navigating this exciting landscape, transforming raw data into a powerful force for your business.
Creating IoT Dashboards and Visualizations: Unveiling the Power of Data
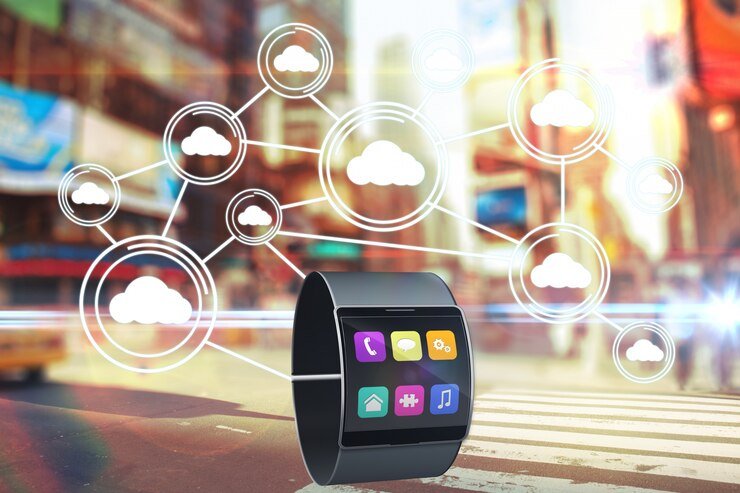
At its core, an IoT dashboard is a visual interface that aggregates and displays data from various connected devices. Think of it as the central nervous system of your IoT solution, providing a real-time snapshot of your connected systems. This goes beyond simply displaying numbers; effective IoT visualization transforms raw data from diverse sources like IoT data streaming (using protocols like MQTT) and REST API integration into meaningful charts, graphs, and maps. This allows for easy data interpretation and facilitates data-driven insights. It’s about turning complex IoT metrics into a story that anyone can understand, regardless of their technical expertise. The process involves careful data visualization and dashboard development. You’re not just looking at numbers; you’re watching your business unfold in real-time.
The Transformation: From Chaos to Clarity
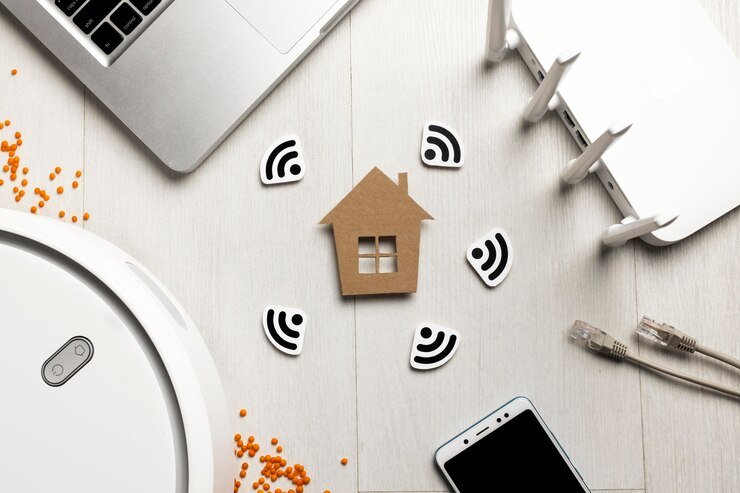
The benefits are transformative. Imagine the power of real-time dashboard monitoring for remote monitoring of industrial equipment, enabling predictive maintenance and preventing costly downtime. Picture a smart home dashboard that seamlessly manages energy consumption, security systems, and even your entertainment, all from your smartphone. For businesses, effective data presentation on an IoT analytics dashboard translates to:
- Improved efficiency: Identify bottlenecks, optimize processes, and streamline operations with ease using IoT data analytics.
- Enhanced decision-making: Make informed choices based on reliable, real-time data. Leverage data analysis tools for insightful reports.
- Reduced costs: Prevent costly equipment failures, optimize resource allocation, and enhance overall profitability. An energy monitoring dashboard, for instance, can significantly reduce energy waste.
- Increased revenue: Improve customer satisfaction, offer new value-added services, and gain a competitive edge.
Real-World Applications: IoT Dashboards in Action
The impact of well-designed IoT dashboards spans numerous sectors. Consider these examples:
- Industrial IoT Dashboard: In manufacturing, an industrial IoT dashboard offers a unified view of production processes, allowing for real-time adjustments and proactive issue resolution. This ensures smooth operations and reduces waste.
- Smart City Dashboard: In urban environments, a smart city dashboard provides insights into traffic flow, pollution levels, and resource management, optimizing city services and improving citizen life.
- Smart Agriculture Dashboard: In agriculture, a smart agriculture dashboard uses sensor data to monitor soil conditions, weather patterns, and crop health, resulting in higher yields and efficient resource utilization. This is critical for creating a sustainable smart agriculture dashboard.
- Healthcare IoT Dashboard: A healthcare IoT dashboard monitors patient vitals, allowing for timely intervention and improved patient outcomes. This contributes to a safer and more efficient healthcare system.
- Fleet Management Dashboard: A fleet management dashboard helps businesses optimize routes, monitor fuel consumption, and improve driver safety, reducing operational costs and enhancing productivity.

Navigating the Challenges: Addressing Limitations and Concerns
While the possibilities are vast, certain challenges need to be addressed:
- Data Security: Protecting sensitive data is paramount. Robust security measures are crucial to prevent unauthorized access and maintain data security throughout your IoT implementation.
- Data Processing: Handling large volumes of data requires powerful IoT data processing capabilities and efficient IoT data platform solutions.
- Scalability: Your IoT analytics platform should be capable of scaling to accommodate future growth and evolving needs. This is essential for developing scalable dashboards.
- Dashboard Design: A poorly designed dashboard can lead to information overload and hinder decision-making. Prioritize a user-friendly dashboard with effective data visualization best practices.
The Future of IoT Dashboards: A Glimpse into Tomorrow
The future of IoT dashboards promises even greater sophistication. We can expect:
- Advanced Analytics: Integration of machine learning and AI for predictive modeling, anomaly detection, and more precise insights.
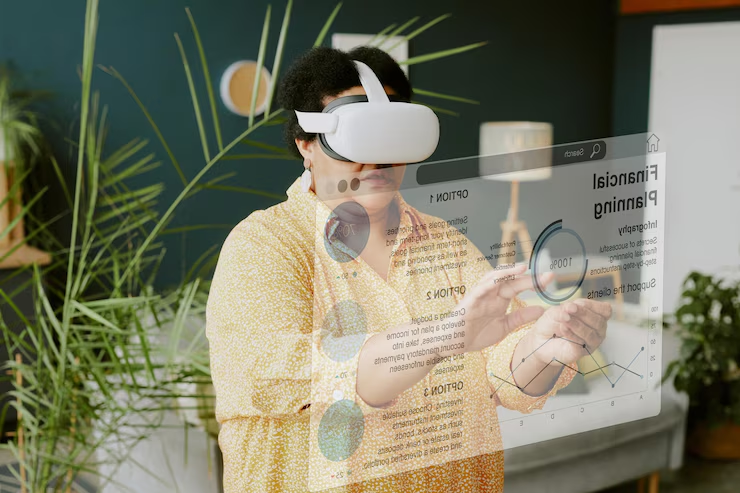
- Enhanced Interactivity: More intuitive and engaging interfaces, incorporating augmented reality and virtual reality for immersive data visualization.
- Improved Integration: Seamless integration with diverse data sources and platforms, forming a holistic view of connected systems. This requires robust IoT platform integration.
- Wider Adoption: Increased adoption across various industries, driving innovation and efficiency across the board.
Getting Started: Your Journey into IoT Dashboard Design
The first step is to define your needs. What specific data do you want to monitor? What insights do you want to gain? Choosing the right data visualization software is crucial. Many platforms offer powerful visualization tools, including the ability to create custom dashboard solutions tailored to your needs. Consider factors such as cloud-based IoT dashboard options, embedded dashboard solutions, and the ability to support various communication protocols such as MQTT dashboard or REST API integration.
Summary:
IoT dashboards are a game-changer, converting raw data into strategic advantage. By leveraging effective IoT visualization, businesses can enhance efficiency, drive informed decisions, and unlock unprecedented levels of innovation. However, successful IoT implementation requires careful planning, robust security, and a focus on intuitive data presentation. The future holds immense potential, with advanced analytics and seamless integration transforming the landscape of connected devices and connected systems.
Common Questions:
- Q: What’s the difference between an IoT dashboard and a regular data dashboard? A: An IoT dashboard specifically focuses on data from connected devices, offering real-time monitoring and control.
- Q: What are the best data visualization techniques for IoT dashboards? A: Effective techniques include line graphs, bar charts, maps, gauges, and dashboards that utilize kpi dashboard and performance dashboard layouts.
- Q: How can I ensure data security in my IoT dashboard? A: Implement robust authentication, encryption, and access control measures. Choose secure platforms and comply with relevant data privacy regulations.
Call to Action:
Start exploring the world of IoT dashboards today! Research available platforms, explore data visualization software, and begin your journey towards transforming data into actionable insights. Share your experiences and questions in the comments below!
(Note: I’ve incorporated many of the keywords throughout the text. Remember to add actual links to authoritative sources and studies for a complete and compelling blog post.)